Merge Data
Sometimes, data doesn’t mean too much on its own. Rather, it’s the interplay between a user’s answer to several questions that is truly significant. In situations like this, you may want to merge response graphs together to get a clearer understanding of the data.
Merging Data
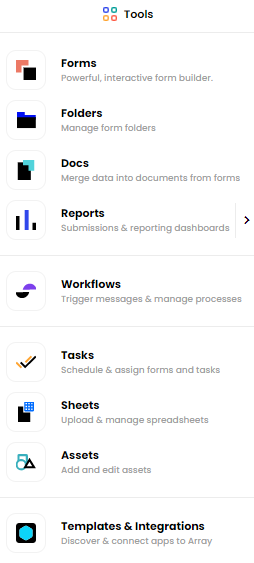
To access the data you can merge, start by clicking the Report button in the 'Tools' dropdown menu which can be found in the top right hand corner, next to your account name.

This will bring you to the View Reports. Here you’ll see all of your projects, sorted according to their Array folder. Click on a folder to view data from the individual forms included in it.
Once you have found a form you would like to merge data, click on the Graph button.

Now you can drag one graph on top of another; you will see a “Merge Reports” icon appear while the graph is being dragged. Once you let go, a new graph will be created that reflects the answers to both questions.
Related Articles
View Your Data
To view your data there are many different ways depending on what data you want to see. To view your data there are many different ways depending on what data you want to see. In this Article, we'll be showing you how to View your data View your ...View & Restore Deleted Data
To help restore soft-deleted data you need. To restore soft-deleted data you need to take many of the steps as if you were going to completely remove the data from Array. We first start by showing the soft-deleted data that you have on your account. ...Downloading Your Report Data
All your data is available to be downloaded through the Reports section, at various points. All your data is available to be downloaded through the Reports section, at various points. There are several formats available and depending on where you are ...Delete/Completely Remove Your Data
Deleting data can be achieved in a few different ways. You can delete submissions in general or you can delete the data from each submission Deleting data can be achieved in a few different ways. You can delete submissions in general or you can ...Edit a Submission
Submissions that needs changing or some of the data itself that has been collected is incorrect and needs updating. Editing/ Updating a submission is something that we will all come across at some stage, whether it be the location of submission that ...