Dash Builder
Dash Builder allows you to build a Canvas for your dash.
In this article, we’ll be showing you
The Dash Builder
The Dash Builder allows you to build a Canvas with all the information for you to see on your Array dash.
Take a look at Canvas for further information.
To get to the Dash Builder, on the Canvas page, click on the plus button in the top right hand corner of the page
A pop up window will appear. Add a name for your Canvas
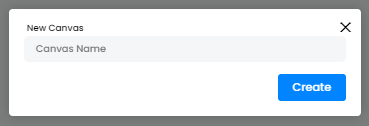
Once you have given your Canvas a name, click on the ‘Create’ button

You will be taken to the Dash Builder.
The Toolbox
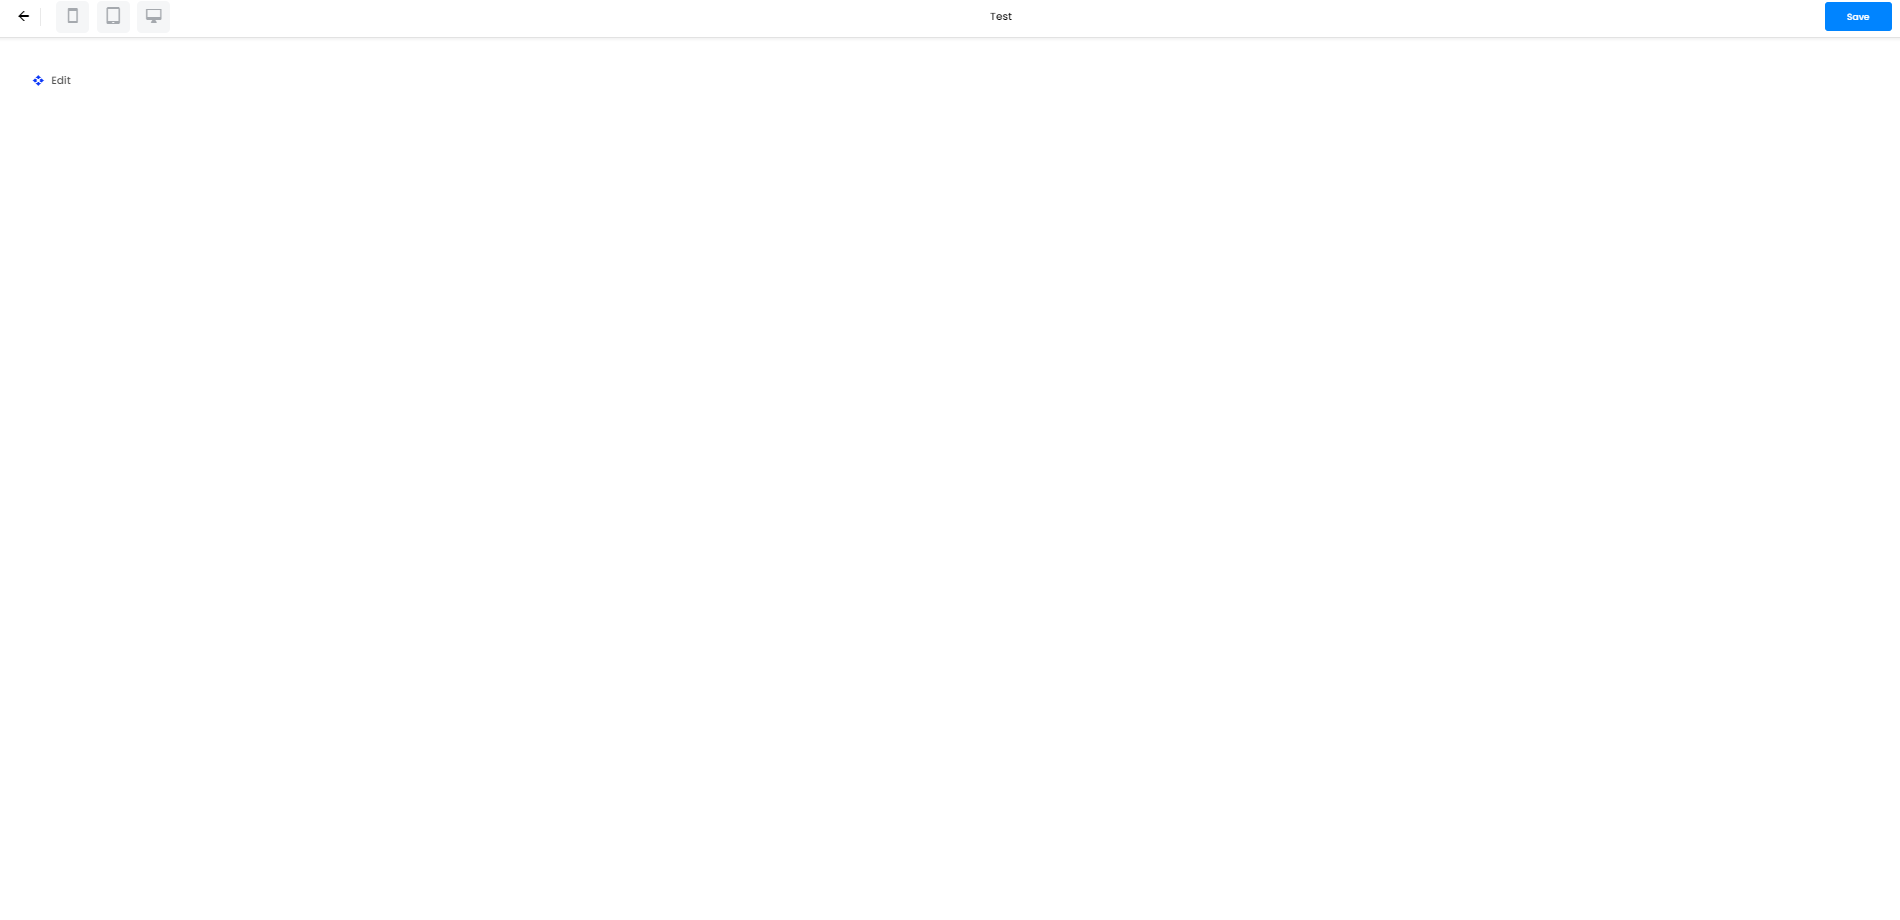
The toolbox contains all the tiles to customize your Canvas. To load up the toolbar, click on the ‘Edit’ button in the top left hand corner.

This will now change to ‘Save’ and ‘New tile’
Click on ‘New tile’ and a toolbox will appear down the left hand side of the page.
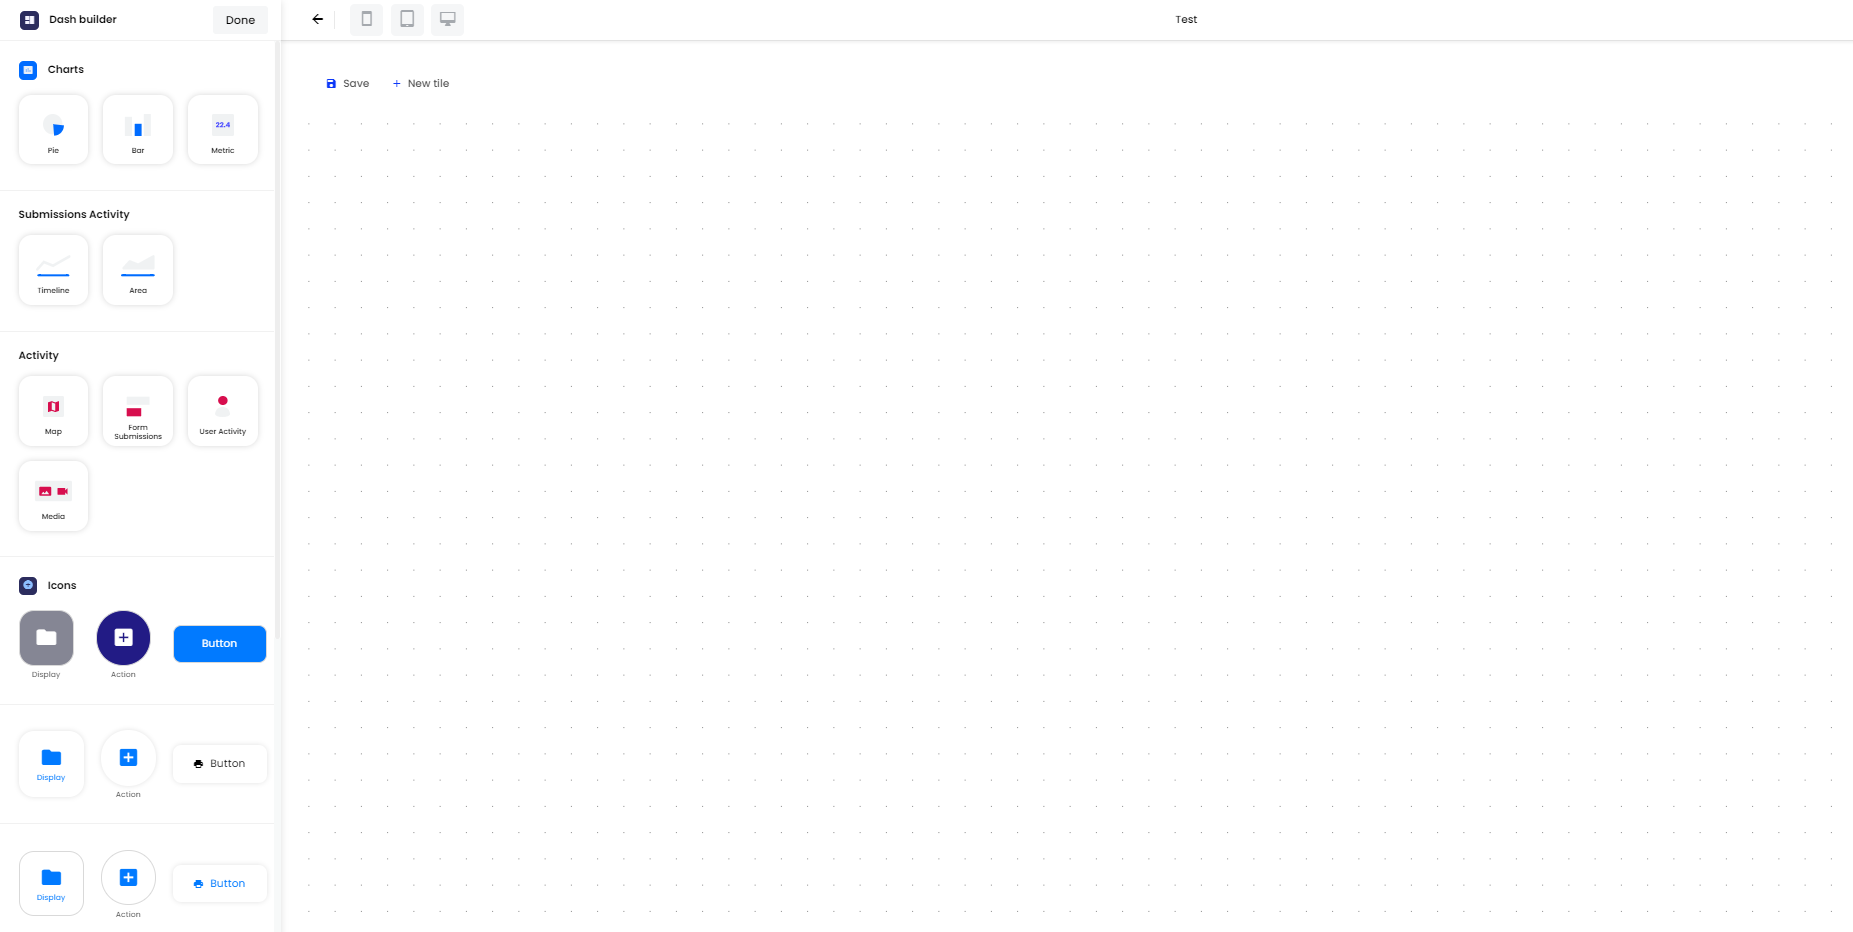
Just like our forms, you can drag and drop the tiles from the toolbox to the Canvas.
You have the option to select
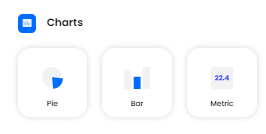
- Charts
- Pie
- Bar
- Metric
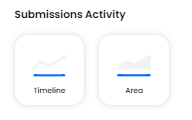
- Submission Activity
- Timeline
- Area
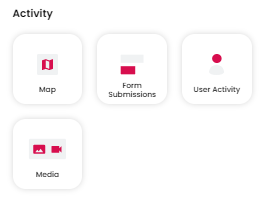
- Activity
- Map
- Form Submissions
- User Activity
- Media
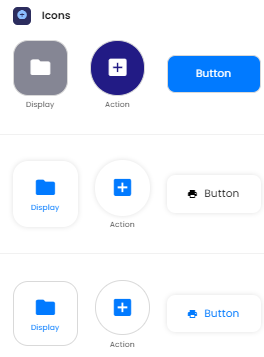
- Icons
- Display
- Action
- Button
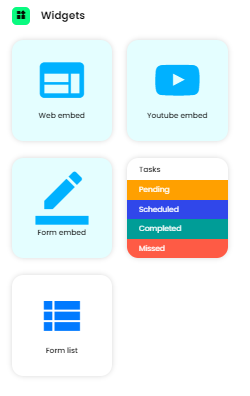
- Widgets
- Web embed
- YouTube embed
- Form embed
- Tasks
- Form list
When you drag and drop a tile, the toolbox will change to allow you to change the options on that tile. There are many options on the different tiles such as folders, forms, users etc. You can also give your tile a name.
Once you have selected all the options, click ‘Done’ at the top of the toolbox

Once you have finished your Canvas, click on ‘Save’ in the top left hand corner
Then click ‘Save’ in the top right hand corner

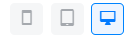
You can also preview how your Canvas will look on different devices in the top left hand corner. You can choose from desktop, tablet or mobile devices.
An example
In this example we have placed a pie chart.
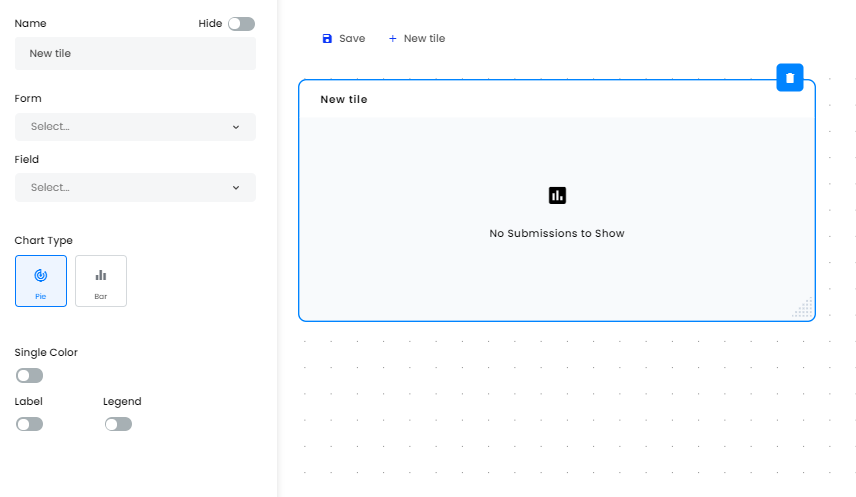
In this pie chart, you can give it a name at the top and choose to show or hide the name
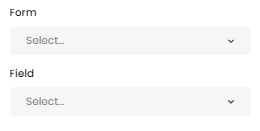
You can select what form and field we would like our information to come from
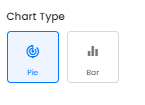
You can switch between ‘Pie’ or ‘Bar’ charts
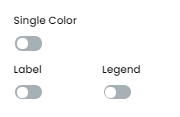
You can also change the color, add a label and a legend
However in this example we have placed a Action Icon
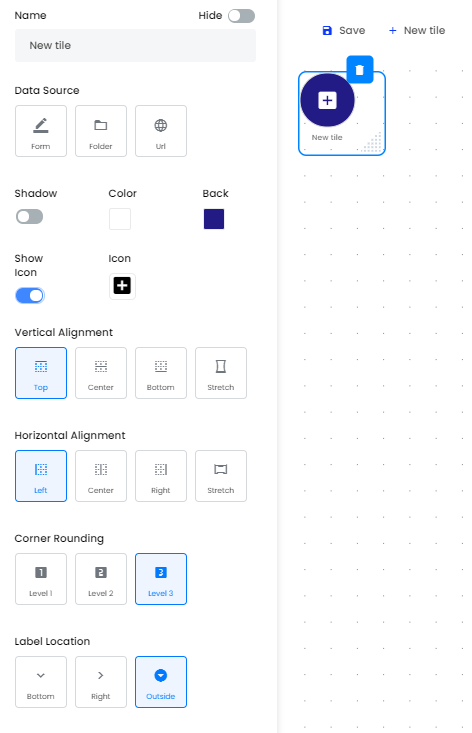
This tile gives you lots of different options to customize it.
Editing and Deleting Tiles
If you decide you need to edit some of the options in a tile, hover over the tile you want to change and a pencil and trash bin button will appear at the top right hand corner of the tile. 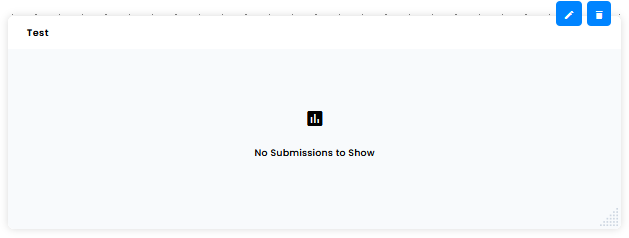
Click on the pencil icon to edit your tile.
If you need to delete the tile, click on the trash bin. A pop up window will appear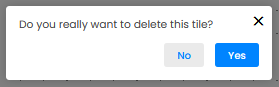
Click on ‘Yes’ to delete your tile.
Related Articles
Canvas
Canvas gives users the chance to customize their dash. Canvas gives users the chance to customize their Array dash so they can see the information they require for their company. In this article, we’ll be showing you: Where to find Canvas How to ...Form Themes
Form themes are a great way of making your form fit within your wider branding. Form themes are a great way of making your form fit within your wider branding. It is especially useful if you are embedding a form on your website, sending out forms to ...